
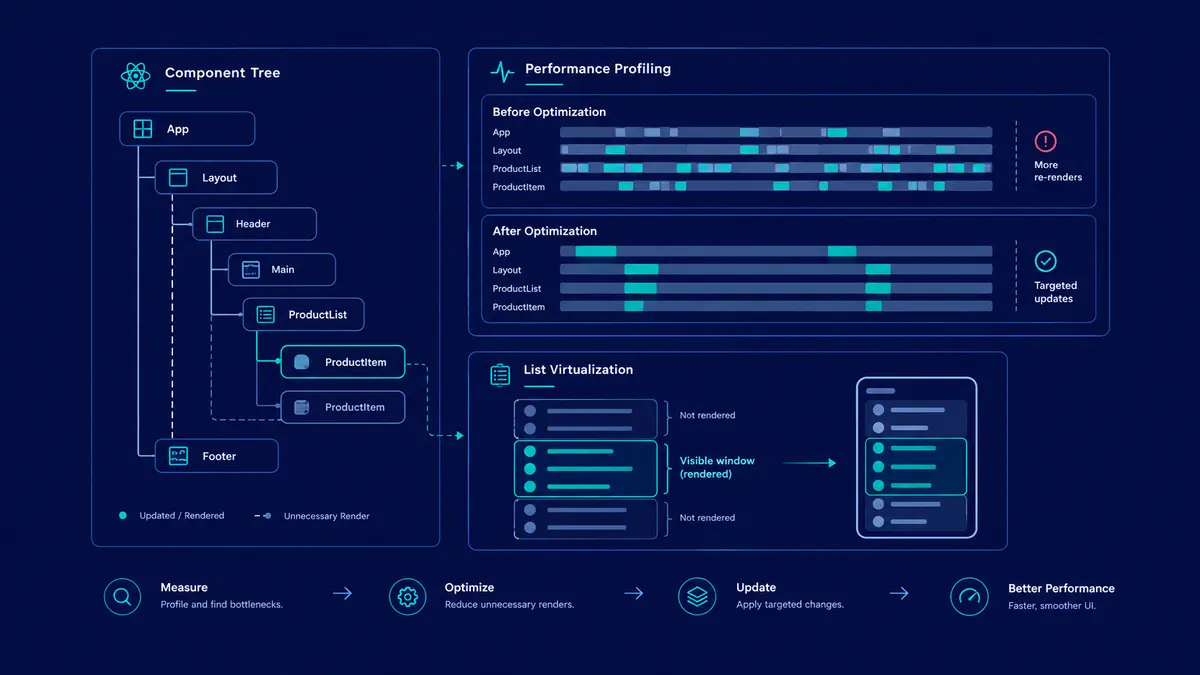
Mastering React Performance Optimization: A Measurement-First Engineering Guide
In web application development, few tasks consume as much engineering effort with as little measurable return as speculative performance optimization. Teams frequently sprinkle useCallback, useMemo, and React.memo across their codebases in the hope of making interfaces feel faster, only to discover that rendering remains sluggish while code readability deteriorates.
Effective React performance optimization is an empirical discipline, not an exercise in adding more hooks. It starts with reproducible measurements, identifies bottlenecks in rendering and browser execution, and validates improvements against real user experience.
This guide presents a measurement-first methodology for diagnosing and improving React performance. It covers rendering mechanics, state colocation, principled memoization, list virtualization, JavaScript bundle optimization, and Core Web Vitals.
1. Measure Before You Optimize
Memoization is not automatically beneficial. Every optimization introduces some combination of implementation complexity, memory overhead, comparison work, or maintenance costs.
For example, wrapping a trivial calculation in useMemo can make a component harder to understand without producing a meaningful performance improvement. Conversely, avoiding an expensive calculation or preventing an unnecessary render of a complex subtree can make a measurable difference.
The objective is not to minimize render counts at any cost. It is to reduce the work that affects responsiveness, loading speed, and visual stability.
The profiling toolkit
Establish a baseline before modifying component code.
React DevTools Profiler
Open the React DevTools Profiler.
Record a specific interaction, such as typing into a search field, opening a modal, or switching dashboard filters.
Inspect the Flamegraph and Ranked views to identify expensive components and repeated rendering.
Examine which components rendered and why, where the available profiling tools provide that information.
Repeat the same interaction after making a change.
Chrome DevTools Performance panel
Record the same interaction in the Performance panel.
Test with CPU throttling to approximate slower hardware.
Inspect scripting, rendering, layout, and painting activity.
Investigate Long Tasks, which are main-thread tasks exceeding 50 milliseconds.
Check whether the bottleneck is JavaScript execution, layout, painting, network activity, or another source of delay.
A Long Task is a useful diagnostic signal, not a universal release criterion. Some tasks exceeding 50 milliseconds may not affect a particular interaction, while several shorter tasks can still produce a poor experience.
A practical diagnostic workflow
Reproduce the slow interaction
            |
            v
Profile React rendering
            |
            v
Inspect browser main-thread activity
            |
            v
Identify the dominant bottleneck
            |
            v
Apply one targeted change
            |
            v
Repeat the same test and compare
Record the conditions of each test, including the dataset, device profile, browser, and interaction. Without a consistent baseline, an apparent improvement may simply reflect different test conditions.
2. Understand React Rendering and Update Costs
A React component may render again when its state changes, a context it consumes changes, or its parent renders and React does not skip that component through an applicable bailout.
A render does not necessarily mean that React will modify the DOM. Understanding this distinction is essential when diagnosing performance problems.
The major stages of an update
1. Render phase
React calls the relevant component functions to calculate the next UI. It reconciles the resulting element descriptions with the previous tree and determines which changes are needed.
Component execution, calculations, and reconciliation can consume CPU time even when the final DOM remains unchanged. In concurrent rendering, React may also pause or abandon some render work before it commits.
2. Commit phase
React applies the necessary changes to the host environment, such as updating DOM nodes and refs. Layout effects, including useLayoutEffect, are processed during the commit-related lifecycle before the browser can paint the resulting update.
A component rendering again does not imply that every DOM node is recreated. React can preserve existing nodes and apply only the changes required.
3. Browser rendering
The browser may recalculate styles, perform layout, paint pixels, and composite layers. The work required depends on the changes, the page structure, CSS, and browser rendering behavior.
Passive effects scheduled through useEffect are generally processed separately from the synchronous DOM commit, but their exact timing depends on the update and React's scheduling behavior.
These stages can have different bottlenecks. A component may render quickly but trigger expensive layout, or it may perform costly calculations without producing significant DOM changes.
State colocation: Reduce unnecessary work at its source
One common source of avoidable rendering is keeping short-lived UI state higher in the component tree than necessary.
Consider a dashboard containing a search field, a chart, and a large table. If the dashboard owns the search query, every keystroke updates the dashboard. Its children may then render again, even if the chart does not depend on the query.
A simplified example:
import { useState } from "react";

export function Dashboard() {
  const [query, setQuery] = useState("");

  return (
    <main>
      <input
        value={query}
        onChange={(event) => setQuery(event.target.value)}
        placeholder="Search records..."
      />

      <RevenueChart />
      <TransactionTable query={query} />
    </main>
  );
}
Here, the dashboard re-renders as the query changes. Unless a child can bail out, its component function may execute again.
The first question should be whether the search state belongs at this level at all. If only a small section needs it, moving that state into the section can reduce unrelated work.
However, state should remain at the appropriate ownership boundary. If other components genuinely need the query, moving it down may introduce unnecessary synchronization or duplicate state.
Pattern 1: Defer expensive rendering with useDeferredValue
When typing must remain responsive while an expensive result list updates, React can prioritize the input update and defer the list's work.
"use client";

import { memo, useDeferredValue, useState } from "react";

type RecordItem = {
  id: string;
  name: string;
};

const RecordList = memo(function RecordList({
  records,
  query,
}: {
  records: RecordItem[];
  query: string;
}) {
  const normalizedQuery = query.toLowerCase();

  const filteredRecords = records.filter((record) =>
    record.name.toLowerCase().includes(normalizedQuery)
  );

  return (
    <ul>
      {filteredRecords.map((record) => (
        <li key={record.id}>{record.name}</li>
      ))}
    </ul>
  );
});

export function Dashboard({
  records,
}: {
  records: RecordItem[];
}) {
  const [query, setQuery] = useState("");
  const deferredQuery = useDeferredValue(query);

  const isStale = query !== deferredQuery;

  return (
    <section>
      <input
        value={query}
        onChange={(event) => setQuery(event.target.value)}
        placeholder="Filter records..."
        aria-label="Filter records"
      />

      <div aria-busy={isStale}>
        <RecordList records={records} query={deferredQuery} />
      </div>
    </section>
  );
}
The memoized list can skip the urgent render while its deferred query remains unchanged. React can then attempt the expensive update in the background and interrupt it when newer urgent work arrives.
Trade-offs: The displayed results can temporarily lag behind the input. useDeferredValue does not automatically reduce network requests, and it does not make the filtering calculation itself faster. If filtering remains expensive, consider better algorithms, indexing, or a worker for suitable CPU-intensive tasks.
Pattern 2: Debounce expensive operations
Debouncing is useful when intermediate updates should be skipped, especially for remote searches or costly operations that do not need to run on every keystroke.
"use client";

import { useEffect, useState } from "react";

export function DebouncedSearchInput({
  onSearch,
  delay = 250,
}: {
  onSearch: (value: string) => void;
  delay?: number;
}) {
  const [query, setQuery] = useState("");

  useEffect(() => {
    const timer = window.setTimeout(() => {
      onSearch(query);
    }, delay);

    return () => window.clearTimeout(timer);
  }, [query, onSearch, delay]);

  return (
    <input
      value={query}
      onChange={(event) => setQuery(event.target.value)}
      placeholder="Search..."
      aria-label="Search"
    />
  );
}
This example assumes that onSearch has a stable identity when the query and delay remain unchanged. If the parent creates a new callback on every render, the effect can repeatedly cancel and restart the timer.
A stable callback may help when its dependencies are stable. Alternatively, a carefully implemented latest-callback ref pattern can separate the timer's lifetime from callback identity.
Trade-offs: Debouncing intentionally delays the operation. Use it when skipping intermediate operations is desirable, not as a blanket solution for every rendering problem. For remote requests, also consider cancellation, stale-response handling, and server-side rate limits.
Pattern 3: Use component composition
Sometimes the best optimization is to avoid making an expensive subtree depend on state that it does not need.
"use client";

import { useState } from "react";

export function CollapsibleContainer({
  children,
}: {
  children: React.ReactNode;
}) {
  const [isOpen, setIsOpen] = useState(true);

  return (
    <section>
      <button
        type="button"
        onClick={() => setIsOpen((open) => !open)}
        aria-expanded={isOpen}
      >
        {isOpen ? "Hide" : "Show"} details
      </button>

      {isOpen && children}
    </section>
  );
}

export function Page() {
  return (
    <CollapsibleContainer>
      <ExpensiveReport />
    </CollapsibleContainer>
  );
}
When the container updates its own state, the children element created by Page retains the same reference, provided Page itself has not re-rendered. This can allow React to avoid re-executing the expensive child component.
The benefit is not unconditional. If Page re-renders, it creates new element objects. Context updates, changed props, and other updates can also cause the child to render again.
The broader principle is to design component boundaries so that unrelated state changes do not propagate unnecessary work.
3. Apply Memoization with a Clear Purpose
React provides three familiar memoization tools, each with a different role.
useMemocaches the result of a calculation between renders when its dependencies remain equal.useCallbackcaches a function reference between renders when its dependencies remain equal.React.memocan skip rendering a component when its props compare equal to their previous values.
These tools are most useful when they remove meaningful work from a measured interaction.
When useMemo helps
Suppose a transaction table sorts a large dataset using a relatively expensive comparator. If profiling shows that the sort materially affects render duration, caching the sorted result may help.
import { useMemo } from "react";

type Transaction = {
  id: string;
  timestamp: number;
  amount: number;
};

export function SortedTransactions({
  transactions,
}: {
  transactions: Transaction[];
}) {
  const sortedTransactions = useMemo(() => {
    return [...transactions].sort(
      (a, b) => b.timestamp - a.timestamp
    );
  }, [transactions]);

  return (
    <ul>
      {sortedTransactions.map((transaction) => (
        <li key={transaction.id}>
          {transaction.id}: {transaction.amount}
        </li>
      ))}
    </ul>
  );
}
The copied array prevents mutation of the original input. The memoized result is reused while the transactions reference remains unchanged.
There is an important caveat: if the parent creates a new array on every render, the dependency changes even when the underlying records have not. Fixing unnecessary data transformations upstream may be more effective than adding more memoization downstream.
When useCallback helps
useCallback is particularly useful when a stable function reference allows a memoized child to skip rendering, or when a callback is a meaningful dependency of another hook.
import { memo, useCallback, useState } from "react";

const SaveButton = memo(function SaveButton({
  onSave,
}: {
  onSave: () => void;
}) {
  return (
    <button type="button" onClick={onSave}>
      Save changes
    </button>
  );
});

export function Editor() {
  const [saved, setSaved] = useState(false);

  const handleSave = useCallback(() => {
    setSaved(true);
  }, []);

  return (
    <section>
      <SaveButton onSave={handleSave} />
      <p>{saved ? "Changes saved" : "Unsaved changes"}</p>
    </section>
  );
}
Because handleSave retains its identity, unrelated renders of Editor do not automatically invalidate SaveButton's props.
useCallback does not make the function's execution faster, nor does it prevent a child from rendering when that child has its own state or a changing context.
When React.memo helps
A memoized component can skip rendering when its props are shallowly equal. It is most useful for expensive components that often receive unchanged props.
import { memo } from "react";

type Product = {
  id: string;
  name: string;
  price: number;
};

export const ProductCard = memo(function ProductCard({
  product,
}: {
  product: Product;
}) {
  return (
    <article>
      <h3>{product.name}</h3>
      <p>${product.price.toFixed(2)}</p>
    </article>
  );
});
This component can benefit if its parent repeatedly passes the same product object reference. If the parent recreates that object on every render, the shallow comparison sees a changed prop and the component renders again.
Avoid introducing custom comparison functions unless there is a clear need. Deep comparisons can cost more than rendering and may become incorrect when component behavior depends on functions or other values outside the compared fields.
Practical rule: First simplify state ownership and data flow. Then profile. Add memoization where it removes demonstrated work, and measure again.
If your project uses React Compiler, check whether it already performs relevant automatic memoization before adding manual optimizations.
4. Virtualize Large Lists and Tables
Rendering thousands of rows creates work for React and the browser. Large DOM trees can increase memory usage, style calculation, layout costs, and the amount of work required during updates.
Virtualization, also called windowing, limits the mounted rows to those near the visible viewport.
For example, a table containing 10,000 records may only need to display a few dozen rows at a time, depending on viewport height and row size. The full dataset can remain available in memory or come from a paginated data source, while only a small visible window is mounted.
When virtualization is appropriate
Consider virtualization when profiling indicates that list rendering or DOM overhead is a significant bottleneck, particularly for:
Large administrative tables and transaction histories.
Long search results.
Activity feeds with thousands of entries.
Complex rows containing multiple controls or nested components.
Libraries such as @tanstack/react-virtual and react-window can help implement this pattern.
Implementation trade-offs
Virtualization introduces its own complexity.
Variable row heights: Rows with unpredictable heights may need dynamic measurement, which can trigger additional layout work.
Overscan: Rendering a few items beyond the viewport can make scrolling smoother, but excessive overscan increases DOM and rendering costs.
Accessibility: Ensure keyboard navigation, focus management, and screen-reader behavior remain understandable when rows mount and unmount.
State and identity: Use stable item identifiers. Do not rely on a row's current position as its identity when sorting, filtering, or inserting records.
Search and pagination: Virtualization does not eliminate the cost of filtering, sorting, fetching, or retaining a large dataset. Those operations may need separate optimization.
Virtualization is a strong tool when the DOM is the bottleneck, but lightweight rows and efficient data processing still matter.
5. Optimize JavaScript Delivery and Core Web Vitals
A fast React component does not guarantee a fast website. Initial JavaScript downloads, hydration, server response time, image loading, and browser layout can all affect the user experience.
Google's Core Web Vitals measure three important dimensions of real-world page experience:
MetricWhat it measuresGood thresholdLargest Contentful Paint (LCP)Loading performance2.5 seconds or lessInteraction to Next Paint (INP)Interaction responsiveness200 milliseconds or lessCumulative Layout Shift (CLS)Visual stability0.1 or less
These thresholds are assessed at the 75th percentile of page visits, with mobile and desktop data considered separately. Passing the thresholds in a local test does not guarantee that real users will have the same results.
Reduce unnecessary JavaScript
Large client-side bundles can increase download, parsing, compilation, and execution time. Audit which code must load immediately and which code can be loaded on demand.
In Next.js, dynamic imports can split certain components into separate chunks. For example, a heavy analytics chart that is not needed for the initial view may be loaded when its section becomes relevant.
"use client";

import dynamic from "next/dynamic";

const AnalyticsChart = dynamic(
  () => import("@/components/dashboard/AnalyticsChart"),
  {
    loading: () => <p>Loading analytics...</p>,
    ssr: false,
  }
);

export function DashboardAnalyticsSection() {
  return (
    <section>
      <h2>Interactive analytics</h2>
      <AnalyticsChart />
    </section>
  );
}
In the Next.js App Router, ssr: false must be configured from a Client Component, not directly inside a Server Component.
Use this option deliberately. Disabling server rendering means the component cannot contribute its rendered content until client-side JavaScript loads and executes. That may be appropriate for a browser-dependent widget, but it can harm initial rendering if applied to important above-the-fold content.
Other effective steps include:
Keeping components server-rendered when client interactivity is unnecessary.
Loading rich text editors and complex charts only when needed.
Removing unused dependencies and inspecting bundle composition.
Splitting code at meaningful route or feature boundaries.
Avoiding unnecessary client-side state and effects.
Avoid request waterfalls
A request waterfall occurs when one operation must finish before another request can begin, even though both could have started earlier.
For example, a page might fetch account details, then wait for the response before requesting dashboard metrics. If the requests are independent, start them concurrently where the architecture permits.
const [account, metrics] = await Promise.all([
  getAccount(accountId),
  getDashboardMetrics(accountId),
]);
This pattern is appropriate when both operations are independent and failures are handled according to the page's requirements. It is not suitable when the second request genuinely depends on the first result.
In Next.js, route-level data fetching in Server Components can help avoid unnecessary client-side request chains. Use caching and revalidation policies intentionally, and ensure authorization and tenant boundaries remain enforced on the server.
Optimize images and layout stability
Images and layout shifts can dominate user experience even when React rendering is efficient.
Provide explicit image dimensions or an aspect ratio to reserve layout space.
Use responsive image sizes appropriate to the rendered viewport.
Use suitable formats such as AVIF or WebP where supported and beneficial.
Prioritize the actual LCP resource when appropriate, rather than eagerly prioritizing every image.
Avoid lazy-loading the image that is expected to be the initial LCP element.
Reserve space for dynamically loaded content, advertisements, and embedded widgets.
Investigate expensive layout changes and forced synchronous layout reads.
For Next.js applications, the built-in Image component can help with responsive image delivery and sizing when configured correctly.
6. Verify Improvements Before Shipping
A performance change is successful when it improves the relevant experience without introducing correctness, accessibility, or maintainability regressions.
Use the following checklist before shipping a significant optimization.
Verification areaWhat to checkUseful toolsReact renderingIdentify repeated expensive renders and unnecessary update chainsReact DevTools ProfilerMain-thread responsivenessInspect long tasks, scripting, layout, and paintingChrome DevTools PerformanceLarge listsMeasure mounted rows, DOM size, and scrolling behaviorDevTools Elements and PerformanceAsset deliveryInspect image sizes, JavaScript bundles, and layout shiftsLighthouse, Next.js toolingUser experienceEvaluate loading, interaction, and visual stabilityPageSpeed Insights, Chrome UX ReportRegression safetyVerify behavior and compare the same scenario before and afterAutomated tests and repeatable profiling
Audit DOM size carefully
You can inspect the number of elements in the current document using the browser console:
console.log(
  "Total DOM elements:",
  document.querySelectorAll("*").length
);
To inspect a particular list, query its container instead:
const listContainer = document.querySelector("#transaction-table");

console.log(
  "List descendant elements:",
  listContainer?.querySelectorAll("*").length ?? 0
);
A missing container and a container with no descendants both produce a count of zero in this example. Confirm that the selector matches the intended element before interpreting the result.
DOM count is a diagnostic measure, not a universal performance score. Two pages with the same number of elements can have very different costs depending on CSS complexity, component behavior, layout patterns, and the devices running them.
Use production-representative measurements
Development mode is useful for debugging but may introduce extra work that does not reflect production behavior. Validate important changes with production-like builds and realistic data.
For real-user performance, review field data over an appropriate period. Laboratory tests are valuable for repeatable diagnosis, while field data shows how actual devices, networks, and user interactions behave.
React's programmatic <Profiler> API can also measure a component tree's rendering behavior. Remember that profiling introduces overhead and is disabled by default in ordinary production builds unless a profiling-enabled build is used.
Finally, record what changed and what improved. If a modification adds complexity without producing a meaningful improvement, reconsider whether the optimization is worth retaining.
Conclusion
React performance optimization is an iterative engineering discipline grounded in measurement. Start by reproducing the problem, identify whether the bottleneck lies in React rendering, JavaScript execution, DOM complexity, network requests, or browser layout, and apply the smallest change that addresses the cause.
Colocate state where practical. Use deferred rendering when expensive updates should not block urgent input. Debounce operations when skipping intermediate work is desirable. Virtualize large lists when DOM overhead becomes significant, and split bundles when unnecessary JavaScript delays the experience.
Memoization belongs in this process, but it is not the process itself. useMemo, useCallback, and React.memo are most valuable when they eliminate work that matters and their benefits are confirmed through profiling.
At Aformix, we build our own software products and also take on client work: custom web development, WordPress development, SEO, and software and SaaS engineering. Our approach emphasizes maintainable component boundaries, predictable data flow, and evidence-based engineering decisions that help web applications remain responsive as they grow.
The goal is not to make React render as little as possible. It is to deliver the right interface, at the right time, with as little unnecessary work as possible.